数据准备
本示例我们使用红酒数据集。
>>> from sklearn import datasets
>>> from sklearn.datasets import load_wine
>>> wine_dataset = load_wine()

>>> print("数据集特征 shape:", wine_dataset.data.shape)
数据集特征 shape: (178, 13)

>>> print("数据集标签 shape:", wine_dataset.target.shape)
数据集标签 shape: (178,)

>>> print("特征名称:", wine_dataset.feature_names)
特征名称: ['alcohol', 'malic_acid', 'ash', 'alcalinity_of_ash', 'magnesium', 'total_phenols', 'flavanoids', 'nonflavanoid_phenols', 'proanthocyanins', 'color_intensity', 'hue', 'od280/od315_of_diluted_wines', 'proline']

>>> print("标签对应名称:", wine_dataset.target_names)
标签对应名称: ['class_0' 'class_1' 'class_2']
数据切分使用 train_test_split。
train_test_split:Split arrays or matrices into random train and test subsets
>>> from sklearn.model_selection import train_test_split

# 数据切分
>>> X_train, X_test, y_train, y_test = train_test_split(wine_dataset.data, wine_dataset.target, test_size=0.3, random_state=100)

>>>
print(X_train.shape, X_test.shape, y_train.shape, y_test.shape)
(124, 13) (54, 13) (124,) (54,)
模型训练
>>> from sklearn.tree import DecisionTreeClassifier

>>> clf = DecisionTreeClassifier(random_state=110)
>>> clf.fit(X_train, y_train)
DecisionTreeClassifier(random_state=110)
>>> print("score on train dataset:", clf.score(X_train, y_train))
score on train dataset: 1.0
>>> print("score on test dataset:", clf.score(X_test, y_test))
score on test dataset: 0.8333333333333334
画决策树
我们使用 export_graphviz 生成决策树的图像到 DOT 格式
export_graphviz: Export a decision tree in DOT format.
>>> from sklearn.tree import export_graphviz

>>> dot_data = export_graphviz(clf)

print(dot_data)
digraph Tree {
node [shape=box] ;
0 [label="X[12] <= 755.0\ngini = 0.645\nsamples = 124\nvalue = [45, 52, 27]"] ;
1 [label="X[6] <= 1.275\ngini = 0.454\nsamples = 74\nvalue = [2, 50, 22]"] ;
0 -> 1 [labeldistance=2.5, labelangle=45, headlabel="True"] ;
2 [label="X[10] <= 1.005\ngini = 0.153\nsamples = 24\nvalue = [0, 2, 22]"] ;
1 -> 2 ;
3 [label="gini = 0.0\nsamples = 22\nvalue = [0, 0, 22]"] ;
2 -> 3 ;
4 [label="gini = 0.0\nsamples = 2\nvalue = [0, 2, 0]"] ;
2 -> 4 ;
5 [label="X[0] <= 13.175\ngini = 0.077\nsamples = 50\nvalue = [2, 48, 0]"] ;
1 -> 5 ;
6 [label="gini = 0.0\nsamples = 44\nvalue = [0, 44, 0]"] ;
5 -> 6 ;
7 [label="X[1] <= 2.125\ngini = 0.444\nsamples = 6\nvalue = [2, 4, 0]"] ;
5 -> 7 ;
8 [label="gini = 0.0\nsamples = 4\nvalue = [0, 4, 0]"] ;
7 -> 8 ;
9 [label="gini = 0.0\nsamples = 2\nvalue = [2, 0, 0]"] ;
7 -> 9 ;
10 [label="X[5] <= 2.125\ngini = 0.249\nsamples = 50\nvalue = [43, 2, 5]"] ;
0 -> 10 [labeldistance=2.5, labelangle=-45, headlabel="False"] ;
11 [label="X[10] <= 0.803\ngini = 0.278\nsamples = 6\nvalue = [0, 1, 5]"] ;
10 -> 11 ;
12 [label="gini = 0.0\nsamples = 5\nvalue = [0, 0, 5]"] ;
11 -> 12 ;
13 [label="gini = 0.0\nsamples = 1\nvalue = [0, 1, 0]"] ;
11 -> 13 ;
14 [label="X[3] <= 27.5\ngini = 0.044\nsamples = 44\nvalue = [43, 1, 0]"] ;
10 -> 14 ;
15 [label="gini = 0.0\nsamples = 43\nvalue = [43, 0, 0]"] ;
14 -> 15 ;
16 [label="gini = 0.0\nsamples = 1\nvalue = [0, 1, 0]"] ;
14 -> 16 ;
}
使用 graphviz 画出决策树
import graphviz

graph = graphviz.Source(dot_data)
graph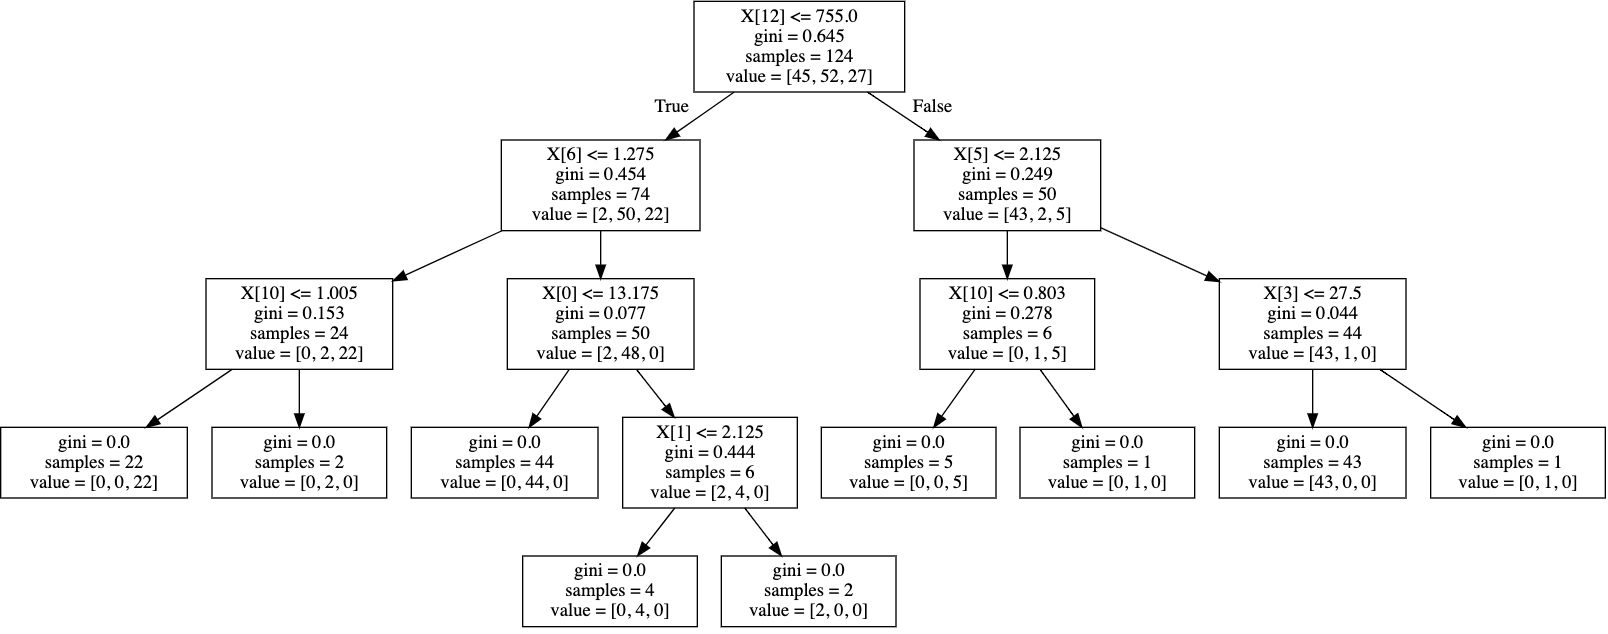
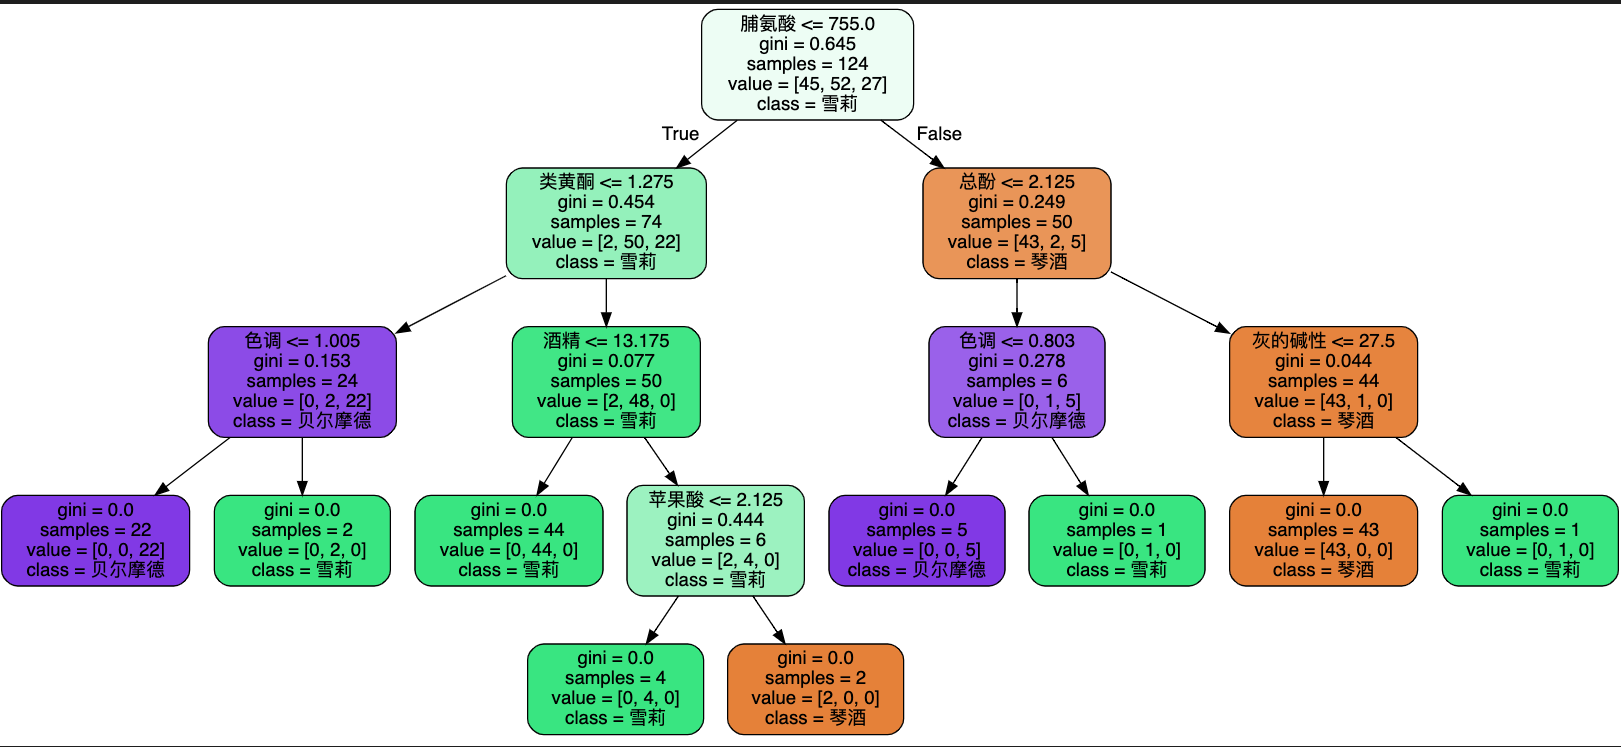
调整画图参数
我们调整画图参数,让决策树更易阅读
feature_name = [
    "酒精",
    "苹果酸",
    "灰",
    "灰的碱性",
    "镁",
    "总酚",
    "类黄酮",
    "非黄烷类酚类",
    "花青素",
    "颜色强度",
    "色调",
    "od280/od315稀释葡萄酒",
    "脯氨酸",
]

class_names = ["琴酒", "雪莉", "贝尔摩德"]

dot_data = export_graphviz(
    clf,
    feature_names=feature_name,
    class_names=class_names,
    filled=True,
    rounded=True,
)

import graphviz

graph = graphviz.Source(dot_data)
graph